Building a UCITS‑Only Quarterly Top‑5 Rank‑Weighted Momentum Strategy
An end-to-end implementation of a UCITS‑compliant quarterly momentum rotation strategy, complete with Bayesian parameter tuning, walk‑forward validation and practical insights from real‑world retail constraints.

Momentum strategies have long delivered strong, robust risk‑adjusted returns with relative simplicity. In this project, I build on three key studies that directly informed my approach:
- Moskowitz, Ooi, and Pedersen (2012): Documents the prevalence and persistence of time‑series momentum across futures and equity indices.
- Hurst, Ooi, and Pedersen (2014): Explores cross‑sectional and time‑series momentum in global equity markets.
- Krauss, Do, and Huck (2018): Compares simple momentum rules against machine‑learning models, finding basic look-back strategies difficult to beat.
Findings guided my design of a UCITS‑compliant ETF rotation strategy.
Strategy Methodology & Backtesting Framework
- Universe: UCITS‑listed, total‑return ETFs accessible via my Interactive Brokers retail account. This limitation forced a narrower ETF set — excluding some high‑quality non‑UCITS funds.
- Data Range: May 2015 to May 2025 daily NAVs.
- Momentum Signal: 12‑month total return look-back; alternate windows (6, 9, 24 m) were explored in experimentation.
- Selection & Weighting: At each quarter‑end:
- Rank ETFs by momentum.
- Select top five.
- Allocate capital proportionally to rank (highest momentum = highest weight).
- Trading Costs & Constraints: Strategy assumes 1 % p.a. annualized flat trading cost; benchmarks (ACWD, S&P 500) assume 0.1 % p.a. turnover. Position limits and liquidity filters ensure UCITS compliance.
Backtests were conducted in a modular Python pipeline, with separate data ingestion, signal generation, portfolio construction, and performance modules. This structure facilitated iterative experiments but grew complex over time—reinforcing code modularization’s importance.
Full methodology details: docs/methodology.md
Parameter Search & Experimental Design
To optimize performance without overfitting, I employed:
- Bayesian Optimization using the
scikit-optimizelibrary to tune look-back windows (6–24 m) and weight scaling parameters. This approach efficiently explored parameter space rather than brute‑force grid search. - Enhancements Tested:
- Volatility scaling (inverse 3‑month volatility).
- Regime filters (50 d vs. 200 d moving average crossover).
- Weighting schemes (raw returns vs. rank‑based scores).
While Bayesian optimization yielded strong in‑sample metrics, these tuned parameters produced unrealistically high backtest returns, indicating overfitting.
See full experiments: docs/experiments.md
Walk‑Forward Validation & Overfitting Mitigation
To ensure out‑of‑sample robustness, I used a walk‑forward optimization (WFO) scheme:
- Training Window: 2 years.
- Testing Window: 1 year.
- Step Size: 6 months.
At each fold, parameters (fixed 12 m look-back, rank weighting) were applied without re-optimizing to avoid introducing look‑ahead bias. In 14 out‑of‑sample folds:
| Metric | Strategy | ACWD | S&P 500 |
|---|---|---|---|
| Avg. CAGR (%) | 12.64 | 10.07 | 14.49 |
| Avg. Max Drawdown (%) | 5.48 | 6.65 | 6.55 |
| Win Rate vs ACWD | 50 % (7/14) | — | — |
| Win Rate vs S&P 500 | 28.6 % (4/14) | — | — |
The consistent performance and controlled drawdowns confirmed that the simple 12 m→3 m top‑5 rotation was most robust.
Detailed walk‑forward results: docs/results.md
Performance Summary (May 2015–May 2025)
| Metric | Strategy (Net) | ACWD (Net) | S&P 500 (Net) |
| Total Return | 163.8 % | 150.2 % | 231.9 % |
| CAGR | 10.19 % | 9.60 % | 12.75 % |
| Max Drawdown | –27.32 % | –49.40 % | –57.42 % |
| Sharpe Ratio | 0.7560 | 0.6825 | 0.8745 |
| Calmar Ratio | 0.3729 | 0.1944 | 0.2220 |
| Alpha vs ACWD (p.a.) | +2.67 % | — | — |
| Alpha vs S&P 500 (p.a.) | +0.49 % | — | — |
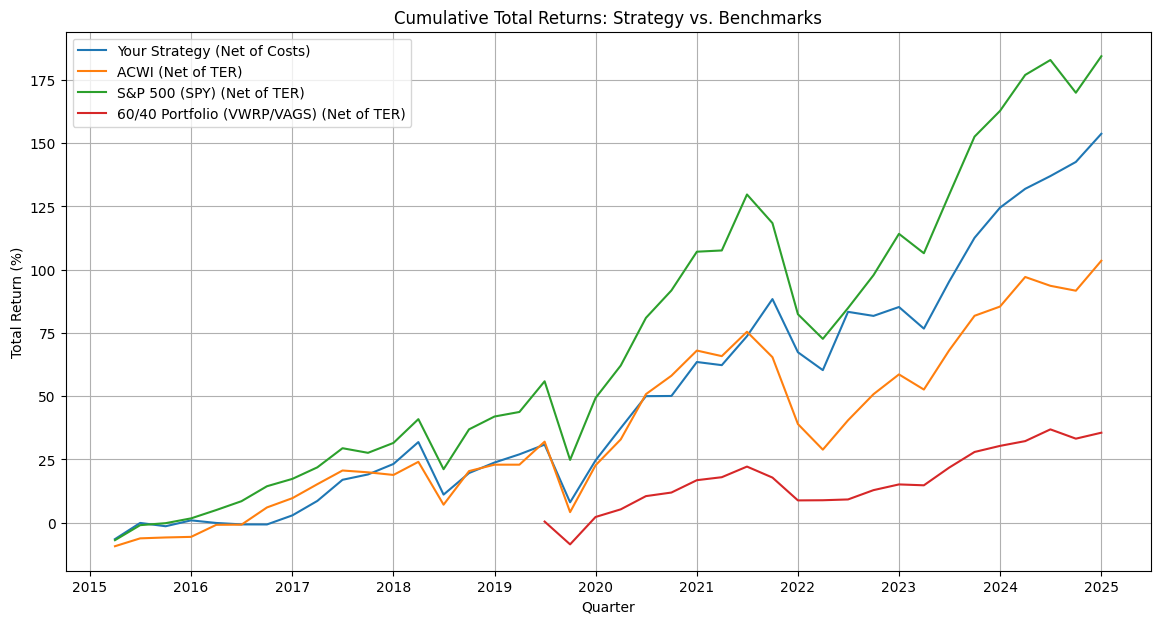
Highlights: lower drawdowns, positive alpha at ~0.78 beta exposure, and robust out‑of‑sample results.
Practical Learnings & Future Directions
- Correct Backtesting Matters | Walk‑Forward Importance: Parameter tuning via Bayesian optimization led to impressive in‑sample gains but failed out‑of‑sample. WFO exposed overfitting, guiding me back to the simple 12 m setup.
- Universe Constraints: Retail account limitations (IBKR UCITS ETFs) significantly cap performance. Non‑UCITS ETFs improved returns in parallel tests—highlighting data scope’s impact.
- Code Modularization: As experiments grew, clean, well‑documented modules ensured reproducibility and easier debugging.
Read more: GitHub: momentum-strategy
Get in touch:
- 📧 alexeyg377@gmail.com
- 🔗 LinkedIn Profile